BLOG
Digging into Data with IDEC
By Kate Nelson, International Data Evaluation Center, and Mary Ann McBride, Teacher Leader
Data is critical to making informed instructional decisions that serve the needs of our most struggling readers, and IDEC data offers a wealth of information to support decision-making.
Recently, I met with Teacher-Leader Mary Ann McBride to discuss how she uses data to inform her decisions. In this blog, we’ll explore how she uses reports to understand how her data compares to national data, how to glean valuable information from site reports, and how to examine lessons per week.
How Do I Stack Up?
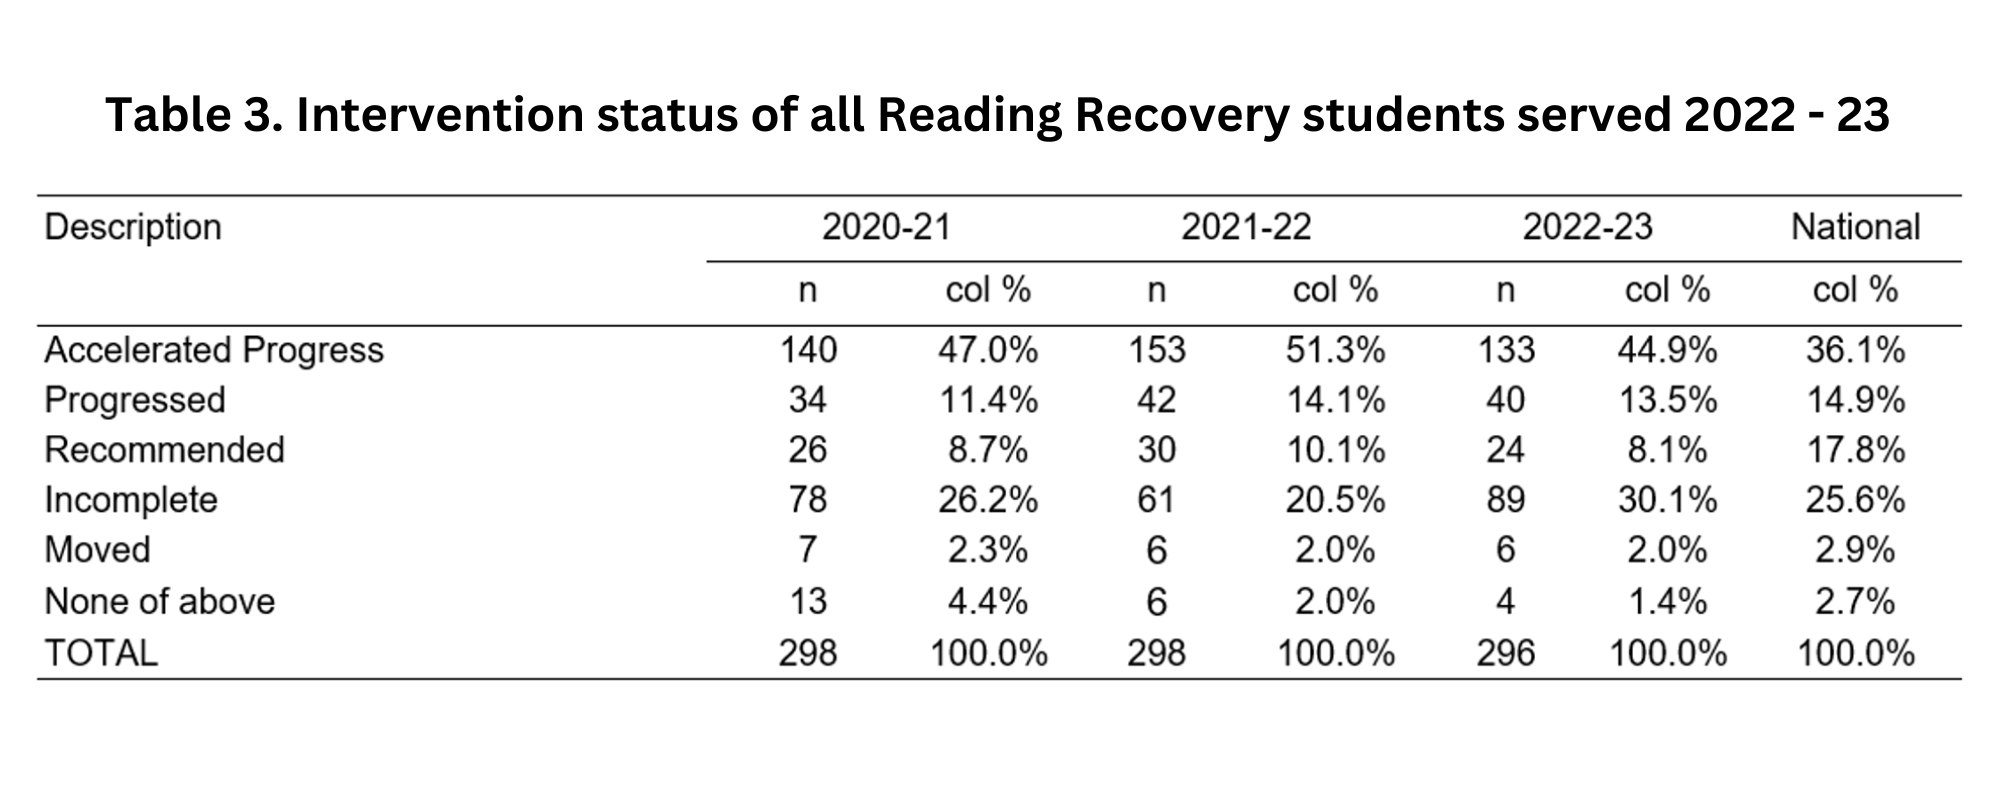
When looking at site reports, Mary Ann and I discussed first comparing the data in her own sites to the national data. Table 3 and Figure 8 are good places to start.

For example, in the table for the site above, in 2022-23 there were higher rates of Accelerated Progress students than the national average (44.9% vs. 36.1%), rates were similar to the national average for Progressed students (13.5% vs. 14.9%), and rates were much lower for students Recommended students (8.1% vs. 17.8%). However, the site had a higher rate of students with a status of Incomplete than the national average (30.1% vs. 25.6%) which invites more investigation. So, while this site was generally favorable when compared to national data, a teacher leader may want to look further at on-demand reports to investigate what may contribute to the higher rate of students with a status of Incomplete.

Additionally, Figure 8 provides a useful visual representation of how a site compares to national data. Figure 8 in the site report illustrates the progress in average text reading levels of first and second round Accelerated Progress students compared to first and second round Accelerated Progress students nationally. Above, the site’s first round Accelerated Progress students were just below the national Accelerated Progress students (19.1% vs. 20.2%), but the site was slightly ahead of the national average for second round Accelerated Progress students (19.6% vs. 19.0%). Additionally, both first and second round Accelerated Progress students from the site and the nation had much lower averages in the fall than the national random sample but exceeded the random sample text reading level at the end of the year.
_______________
Digging Deeper: Student Data
In my discussion with Mary Ann, Table 5 of the site report was highlighted as a critical table as it reveals students who were on the cusp of Accelerated Progress. Students who ended the school year at text reading levels of 10, 12, or 14 are such students. These students may have been able to achieve Accelerated Progress given additional time in instruction or if adjustments to their instruction had been made. Table 5 is also helpful in identifying students who ended the school year at high text reading levels but were not given the status of Accelerated Progress.

In the table above, the values marked in yellow represent the number of students who would be considered “cusp” students. Most cusp students fell into the category of Incomplete, a number were made up of Progressed students, and a handful were Recommended students. Table 5 shows there were seven Progressed students, 12 Incomplete, and 1 Recommended student who ended the school year at a text reading level of 16, and while they were also marked in yellow as cusp students, whether they would be considered on the cusp may depend on the requirements of their district. Values marked in green represent students who achieved high text reading levels at year-end (18 or higher) but were not given the status of Accelerated Progress. For instance, 12 students read at a level 18 at the end of the year but were determined to be Incomplete, while four students read at a level 20 but had a status of Progressed. Most of the students marked in green had a status of Progressed and Incomplete but two had a status of Recommended. Examining this table allows teacher leaders to explore ways that instruction may be altered for cusp students to reach acceleration as well as examine practices for determining a student’s exit category.
_____________
Digging Deeper: Teacher Data
When examining the rate of students with a status of Incomplete, or how to find more time for cusp students to reach acceleration, one place to look is lessons per week. In the site report, lessons per week is reported in Table 4.

In the table above, in 2022-23, students in each status category averaged between 3 and 4 lessons per week. However, this table can hide lower rates for individual students or teachers as it averages the lessons per week across the entire site. It may be helpful to examine the Student Data Summary on-demand report. This report lists the students’ names, the number of lessons they received, their number of weeks, the number of missed lessons, average lessons per week, their text reading levels/total scores, and final status.

In the table above, the three students highlighted in yellow had low average lessons per week, ranging from 2.3 to 2.6. These low averages reveal a deeper problem. In a school year of 180 days, it’s reasonable to expect a teacher to provide about 150 lessons across first and second round, providing approximately 75 lessons per student. This allows for testing and any unexpected events. This means that a teacher should provide about 600 lessons in a year. The teacher above provided 316 total lessons, teaching just 51.6% of the time. It may be helpful to examine this on-demand report to monitor patterns of lessons per week, and any connections to students’ statuses at the end of the intervention or teachers with patterns of low rates.
In conclusion, site reports can be a helpful place to start when digging into data. Table 5 is a particularly useful table to examine for potential adjustments to instruction. Another valuable data point to examine is the average lessons per week, both in the site report and on-demand reports. These reports can help teacher leaders monitor data, modify approaches, and potentially result in more students reaching a status of Accelerated Progress.
Learn more about IDEC data with Kate Nelson and Maryann McBride at the Teacher Leader Institute, where they will present “Digging into Data” on Thursday, June 13, 2024.

Kate Nelson is the IDEC International Data Evaluation Center Manager at The Ohio State University. She has a background in literacy, research, and teaching, and earned her Ph.D. in literacy education from The Ohio State University. At OSU, she received training in Reading Recovery and supervised children with reading difficulties in the university reading clinic. She worked with Dr. Lea McGee and colleagues to investigate first graders’ strategic use of information over time, resulting in a Reading Research Quarterly publication, as well as the International Literacy Association’s Dina Feitelson Research Award. She has experience in data analysis and research, as well as working with teachers in professional development and students in K-12 and higher education.

Maryann McBride is currently a Clinical Faculty and Reading Recovery Teacher Leader at Clemson University Reading Recovery and Early Literacy Center for South Carolina. Before joining the Clemson Reading Recovery Center, Maryann spent 30 years as a classroom teacher, reading specialist, Reading Recovery teacher, and Teacher Leader for Prince George’s County Public Schools.
THE JOURNAL OF READING RECOVERY
Spring 2024
Constructing a More Complex Neural Network for Working on Written Language That Learns to Extend Itself by Carol A. Lyons
Reading Recovery IS the Science(s) of Reading and the Art of Teaching by Debra Semm Rich
Predictions of Progress: Charting, Adjusting, and Shaping Individual Lessons by Janice Van Dyke and Melissa Wilde
Teachers Designing for Context: Using Integrity Principles to Design Early Literacy Support in Aotearoa New Zealand by Rebecca Jesson, Judy Aitken, and Yu Liu


