help

Follow My Journey: Learning to Lead

2024-05-07T08:50:56-05:00May 7th, 2024|Latest News|

John Maxwell says that a leader is “one who knows the way, goes the way and shows the way.” As a Reading Recovery Teacher Leader in training, I have learned so many new things about “the way.”  I thought I had a fairly good understanding of Literacy Processing Theory before training, but now I realize how much more I had to learn. One of the most powerful takeaways from this part of my training is a deeper understanding of reading and writing reciprocity. Rather than seeing them as separate activities with obvious connections, I now see how they use the same processes for constructing meaning and how doing one strengthens the other (Clay 2016). This shift in my understanding has changed the priority I place on the writing portion of the lesson. I never want my students to miss out on the “extra power” that reading and writing bring to one another.

Another major shift in my understanding this year has been the importance of teaching language and using an “economy of words.” I have always known that I am an over-teacher, with lots of words, so it wasn’t too surprising that I had to type out long manuscripts for lesson analysis. What was quite revealing, was how much of a factor it played in my time management and teaching effectiveness. My words were really getting in the way of the child’s efficient problem-solving and bogging down the pace of the lesson. I have since worked very hard to be short and concise with my prompts and explanations. Although I remain a work in progress, I can confidently say I have improved a great deal.

One of the most challenging and rewarding parts of this training year has been learning to lead the program for my district. I have been incredibly fortunate to be able to continue learning from my teacher leader, Jan Grisham, while also observing and engaging with teacher leaders in Texas, Missouri, and others, virtually. My amazing university trainer, Donita Shaw, drove me hundreds of miles to be a part of different training classes and learn a variety of ways to lead teachers through Reading Recovery training. Thank you to Rena Comer and Jacinda Weldy, in Nixa, MO. and Carmen Lipscomb and Marcia Kellum in Denton, Texas. These were invaluable experiences for me to have and I appreciate these wonderful teacher leaders for embracing me and answering all of my questions.

As this training year comes to an end and I prepare for my field year of being a Teacher Leader, I am thankful for the opportunity to continue learning “the way” and going “the way” of helping children become confident, independent readers and writers. Hopefully, I’m also ready to show “the way” now too. One thing I’m sure of is that it is a privilege to serve teachers, students, and this learning community. I also know that although my training year is ending, the real work is just beginning!

Digging into Data with IDEC

2024-04-30T08:11:59-05:00April 30th, 2024|Latest News|

By Kate Nelson, International Data Evaluation Center, and Mary Ann McBride, Teacher Leader

Data is critical to making informed instructional decisions that serve the needs of our most struggling readers, and IDEC data offers a wealth of information to support decision-making.

Recently, I met with Teacher-Leader Mary Ann McBride to discuss how she uses data to inform her decisions.  In this blog, we’ll explore how she uses reports to understand how her data compares to national data, how to glean valuable information from site reports, and how to examine lessons per week.

How Do I Stack Up?

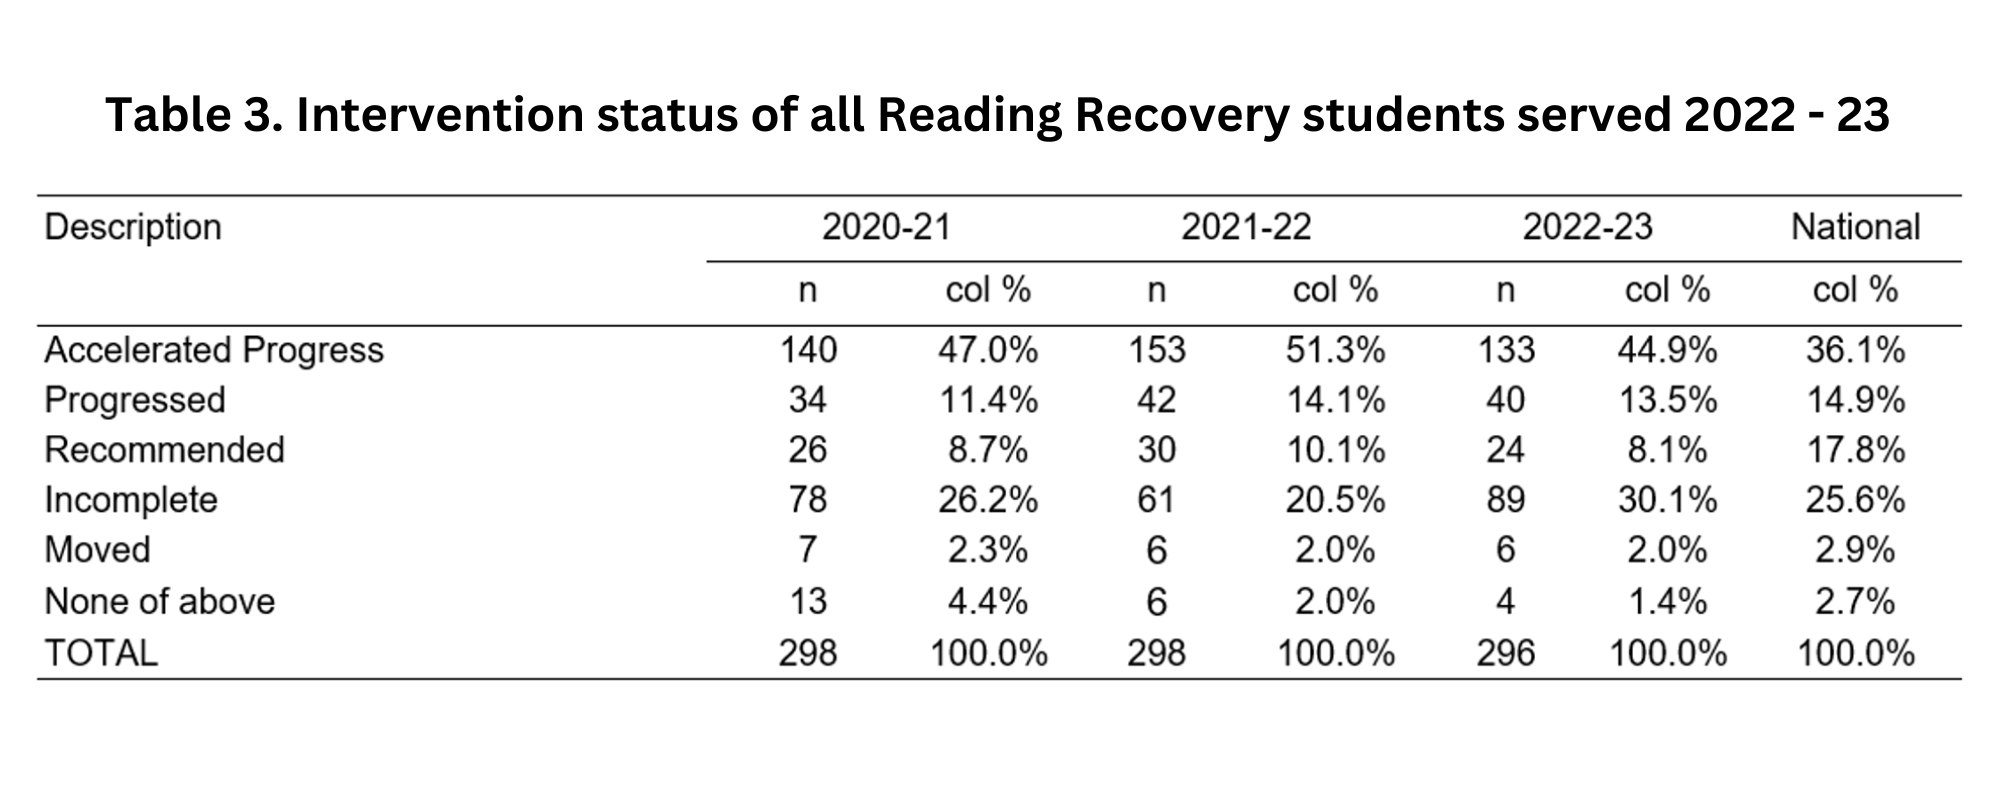
When looking at site reports, Mary Ann and I discussed first comparing the data in her own sites to the national data.  Table 3 and Figure 8 are good places to start.

For example, in the table for the site above, in 2022-23 there were higher rates of Accelerated Progress students than the national average (44.9% vs. 36.1%), rates were similar to the national average for Progressed students (13.5% vs. 14.9%), and rates were much lower for students Recommended students (8.1% vs. 17.8%).  However, the site had a higher rate of students with a status of Incomplete than the national average (30.1% vs. 25.6%) which invites more investigation.  So, while this site was generally favorable when compared to national data, a teacher leader may want to look further at on-demand reports to investigate what may contribute to the higher rate of students with a status of Incomplete.

Additionally, Figure 8 provides a useful visual representation of how a site compares to national data. Figure 8 in the site report illustrates the progress in average text reading levels of first and second round Accelerated Progress students compared to first and second round Accelerated Progress students nationally.  Above, the site’s first round Accelerated Progress students were just below the national Accelerated Progress students (19.1% vs. 20.2%), but the site was slightly ahead of the national average for second round Accelerated Progress students (19.6% vs. 19.0%).  Additionally, both first and second round Accelerated Progress students from the site and the nation had much lower averages in the fall than the national random sample but exceeded the random sample text reading level at the end of the year.

_______________

Digging Deeper: Student Data

In my discussion with Mary Ann, Table 5 of the site report was highlighted as a critical table as it reveals students who were on the cusp of Accelerated Progress. Students who ended the school year at text reading levels of 10, 12, or 14 are such students. These students may have been able to achieve Accelerated Progress given additional time in instruction or if adjustments to their instruction had been made.  Table 5 is also helpful in identifying students who ended the school year at high text reading levels but were not given the status of Accelerated Progress.

In the table above, the values marked in yellow represent the number of students who would be considered “cusp” students. Most cusp students fell into the category of Incomplete, a number were made up of Progressed students, and a handful were Recommended students.  Table 5 shows there were seven Progressed students, 12 Incomplete, and 1 Recommended student who ended the school year at a text reading level of 16, and while they were also marked in yellow as cusp students, whether they would be considered on the cusp may depend on the requirements of their district. Values marked in green represent students who achieved high text reading levels at year-end (18 or higher) but were not given the status of Accelerated Progress. For instance, 12 students read at a level 18 at the end of the year but were determined to be Incomplete, while four students read at a level 20 but had a status of Progressed.  Most of the students marked in green had a status of Progressed and Incomplete but two had a status of Recommended.   Examining this table allows teacher leaders to explore ways that instruction may be altered for cusp students to reach acceleration as well as examine practices for determining a student’s exit category.

_____________

Digging Deeper: Teacher Data

When examining the rate of students with a status of Incomplete, or how to find more time for cusp students to reach acceleration, one place to look is lessons per week. In the site report, lessons per week is reported in Table 4.

In the table above, in 2022-23, students in each status category averaged between 3 and 4 lessons per week.  However, this table can hide lower rates for individual students or teachers as it averages the lessons per week across the entire site.  It may be helpful to examine the Student Data Summary on-demand report.  This report lists the students’ names, the number of lessons they received, their number of weeks, the number of missed lessons, average lessons per week, their text reading levels/total scores, and final status.

In the table above, the three students highlighted in yellow had low average lessons per week, ranging from 2.3 to 2.6.  These low averages reveal a deeper problem. In a school year of 180 days, it’s reasonable to expect a teacher to provide about 150 lessons across first and second round, providing approximately 75 lessons per student. This allows for testing and any unexpected events.  This means that a teacher should provide about 600 lessons in a year.  The teacher above provided 316 total lessons, teaching just 51.6% of the time.    It may be helpful to examine this on-demand report to monitor patterns of lessons per week, and any connections to students’ statuses at the end of the intervention or teachers with patterns of low rates.

In conclusion, site reports can be a helpful place to start when digging into data.  Table 5 is a particularly useful table to examine for potential adjustments to instruction.  Another valuable data point to examine is the average lessons per week, both in the site report and on-demand reports.  These reports can help teacher leaders monitor data, modify approaches, and potentially result in more students reaching a status of Accelerated Progress.


Learn more about IDEC data with Kate Nelson and Maryann McBride at the Teacher Leader Institute, where they will present “Digging into Data” on Thursday, June 13, 2024.

Kate Nelson is the IDEC International Data Evaluation Center Manager at The Ohio State University. She has a background in literacy, research, and teaching, and earned her Ph.D. in literacy education from The Ohio State University. At OSU, she received training in Reading Recovery and supervised children with reading difficulties in the university reading clinic. She worked with Dr. Lea McGee and colleagues to investigate first graders’ strategic use of information over time, resulting in a Reading Research Quarterly publication, as well as the International Literacy Association’s Dina Feitelson Research Award. She has experience in data analysis and research, as well as working with teachers in professional development and students in K-12 and higher education.

___________

Maryann McBride is currently a Clinical Faculty and Reading Recovery Teacher Leader at Clemson University Reading Recovery and Early Literacy Center for South Carolina. Before joining the Clemson Reading Recovery Center, Maryann spent 30 years as a classroom teacher, reading specialist, Reading Recovery teacher, and Teacher Leader for Prince George’s County Public Schools.

What is right is not always popular

2024-05-07T13:44:36-05:00April 16th, 2024|Latest News|

There has been quite a lot to unpack over the past couple of weeks, and the misinformation is running rampant! If the lies weren’t being spotlighted so publicly, we’d simply go on about our work — helping struggling readers and writers with one-to-one intervention as has been our mission for nearly 40 years. As it is, those with the money and power are insistent on creating distractions and scapegoating, and pushing back against misinformation is the unfortunate reality when the media is bought and sold by Big Business. So we must take a pause to reassure those who still care about supporting children’s literacy that yes, RRCNA remains in the fight.

Hanford’s reporting gets exactly one thing right: RRCNA has less money than it did prior to the APM smear campaign. So what? Unlike Hanford and the profiteers behind her, money isn’t our end game. Supporting children’s literacy is.

I’m reminded of an adage: What is right is not always popular. What is popular is not always right. We know we are in the right because we remain laser-focused on children’s right to receive well-rounded, evidence-based literacy instruction, and the fact that RRCNA is a nonprofit makes it all the clearer that money isn’t our motivating factor.

You’re likely asking yourself the obvious question: “Why does this tiny volunteer-led nonprofit of minimal means and even less political cache continue to be the target of such a well-funded smear campaign?”

It seems that we’ve struck a nerve! The profiteers behind the Science of Reading (SOR) grift seem to be getting a little antsy that the education community wants proof of their over-hyped claims of silver bullets.

Consider the timing: Here we are in the weeks leading up to the injunction hearing against Gov. Mike DeWine’s illegal Literacy Statute in Ohio, and suddenly Hanford’s podcast rears its ugly head with more tall tales of CRISIS! At the same time, the honorable governor is making public appearances at SOR-sponsored events aimed at solving the crisis-that-isn’t to shape public opinion with half-informed research. Curiously, he seems blind to anything that debunks claims of structured literacy being a settled science, choosing to repeatedly ignore newer, better science — all to the deficit of Ohio’s most vulnerable learners.

Consider the source: A loud minority of noneducators amplified by right-wing supporters like the Fordham Institute, Moms for Liberty, ExcelinED, and multiple pro-charter school reformers, all with the distinct motive for discrediting public education. As concerned as Hanford is with RRCNA’s finances, she seems suspiciously quiet about the hundreds of millions being thrown at large publishers by way of tax-payer funding. And of course, there’s Hanford herself, who has newfound fame and a slew of speaking engagements worldwide.

The profiteers are starting to get nervous we’ve seen through their game and are willing to take the fight to court. As more and more researchers and educators speak out loudly against SOR moves toward one-size-fits-all basals that have been mandated in Ohio and beyond, more people are asking themselves why if Science of Reading policies work so well, why haven’t they, well, worked for the past 10+ years?

Please show the research that proves structured literacy works best for all kids.

And again we have to ask, why does the popular narrative keep ignoring an entire body of literacy research showing mandated phonics is NOT the answer to our literacy woes? We’ve been asking for proof for decades. Now we’re asking in a court of law. Without the research on their side and with the public getting wise to the grift, all they have left is to attack and scapegoat.

Again I say, so what? Being the scapegoat is nothing when your cause is as important as children’s literacy. I’ve said it before and firmly stand by this belief: Until education experts and real, peer-reviewed research hold more sway than political and corporate interests, those of us who actually care about kids more than money can never stop fighting. While Hanford and her PR machine keep the noise level high, those of us who actually care about the needs of children will keep doing what we do best: serving the child in front of us.

Educators are tired of being lied to and lied about. We know what works best is informed teachers armed with a full toolbox and the autonomy to help ALL children reach their full literacy potential. If you agree, it’s time to stand up, speak out, demand proof, and be part of our mission.

Dr. Billy Molasso is the Executive Director of the not-for-profit Reading Recovery Council of North America.

_____________________

Additional resources:

RRCNA Membership Spotlight: Jonelle Hickerson

2024-03-26T10:32:54-05:00March 26th, 2024|Latest News|

Learn about your colleagues from across the country who do whatever it takes as part of the Reading Recovery Community! Jonelle received a professional development award to attend LitCon this year, thanks to generous donors from the Foundation for Struggling Readers.


Share a favorite Reading Recovery memory.

There are so many, but a recent encounter with parents tops my list. I went Behind the Glass a few weeks ago, and both parents attended. After my lesson, the parents hugged me and talked about how I am the first person to care about their child as much as they do. They told me how he is noticing things and “reading everything.” I love my interactions with the students, but to hear directly from the parents meant the world to me!

What is your favorite book?

The Hungry Giant


What do you like to do for fun?

I enjoy reading and spending time with my adult children.


What insights do you expect to gain from attending LitCon?

I love what I do and I love learning more about it every day. I enjoy delving into Literacy Lessons and trying to figure out what my student needs. I feel that the presenters at LitCon are just the people that can help me further my learning and in turn further my student’s learning as well.

The Four Fallacies of the Media’s Representation of Literacy

2024-03-19T13:25:05-05:00March 19th, 2024|Latest News|

The following is a publication from a group of Concerned Educators in Massachusetts 2024, urging state legislators to resist a one-size-fits-all approach to literacy instruction. “If not done well,” they share, “policy decisions related to reading curriculum and instruction could permanently damage the positive change you hope to effect—a child’s ability and desire to read.” While citing Massachusetts-specific examples, this document reflects the concerns of literacy educators nationwide and is relevant in many states where restrictive literacy legislation is taking hold.

The “Proficiency” Fallacy

“Proficiency” is one of the most misused statistics in education, according to Peter Green, and we agree. Those invested in the narrative that public schools are failing like to quote the NAEP scores.

As outlined on the National Center for Educational Statistics website, in 2022, the average score of fourth-grade students in Massachusetts was 227—higher than the average score of 216 for students in the nation. The average score for students in MA in 2022 (227) was lower than their average score in 2019 (231) and was not significantly different from their average score in 1998 (223). This trend has been seen nationwide.

Learning was disrupted during the pandemic, and we know that teachers make a difference, so it comes as no surprise to see lower post-pandemic scores. Dr. Catherine Snow, a language and literacy pioneer at Harvard, says she’s “puzzled by the public discourse about a literacy crisis.” The NAEP data declined even more in math than reading, with the sharpest declines for the students below the 50th percentile who relied more heavily on support services, suggesting other factors are at play.

The “Science is Settled” Fallacy 

Popular media suggests that the science is settled on literacy, and public schools got it wrong. Journalists reference the Simple View of Reading (1986) as “the settled science.” The Simple View demonstrates the importance of both phonics and language comprehension for skilled reading, but there’s more to the story. A reliance on science from the 80’s ignores important advancements in the past 30+ years.

The most current research is far more nuanced, taking into account factors such as executive functioning skills, motivation, and sociocultural context.  Well-respected researchers in the field of literacy are wary of curriculum developers who claim alignment with the SOR in order to sell products. For example, Nell Duke (2020) cautions that “research being cited is out of date… and we have to be careful not to oversimplify.” Recent key developments in the science of reading include Disrupting Racism and Whiteness in the Science of Reading, and in-depth explorations of culturally destructive literacy practices which pose specific critiques of several of the DESE’s  approved “high quality” curricula.

The “One Size Fits All” Fallacy 

School systems are being asked to trade in their classroom libraries and adopt a one-size-fits-all reading curriculum. One size does not fit all in literacy instruction. Teachers use a variety of methods and tools to reach each learner.

In our school districts, the core curriculum and instructional strategies are research-based and address the standards for teaching and learning, as outlined in the MA ELA Curriculum Frameworks. Classroom literacy instruction includes the essential components of reading (i.e., phonemic awareness, phonics, fluency, comprehension, and vocabulary), integrates writing and emphasizes comprehension across diverse, grade-level, complex texts.

From a recent NY Times article: “I stopped looking for these silver bullets,” said Alberto M. Carvalho, the superintendent in Los Angeles, which has seen above-average recovery compared with the rest of California, including strong recoveries for Black and Hispanic children. “More often than not, it is the compound effect of good strategies.”

The “Proven High Quality Instructional Materials (HQIM)” Fallacy 

In Massachusetts, Bill S.263, “An Act to Promote High Quality Literacy Instruction,” is wending its way through the legislature. This bill, similar to those in other states, would force MA school districts to choose from a narrow list of curricula largely limited to basal anthologies without opportunities for teacher and student choice. Most do not realize that if the bill is successful, MA school districts would be unable to comply because none of the approved curricula have a demonstrated level of success (or “Impact on Learning” rating.)

For the past three years DESE has advocated for districts to select a curriculum from this HQIM list, but they have yet to publish data for districts where this shift has made a continuous impact on student learning. If there were irrefutable gains in student outcomes, it would be logical to change to a new curriculum. In the absence of proven results, we believe it’s best to leave educational decisions to local educators who understand the needs of their students. We urge our legislators to demand a thorough and rigorous educational review of any potential mandated or recommended curricula.


Register here for Talking the Talk: Tips for Responding to Those Tricky Questions about the Teaching of Reading